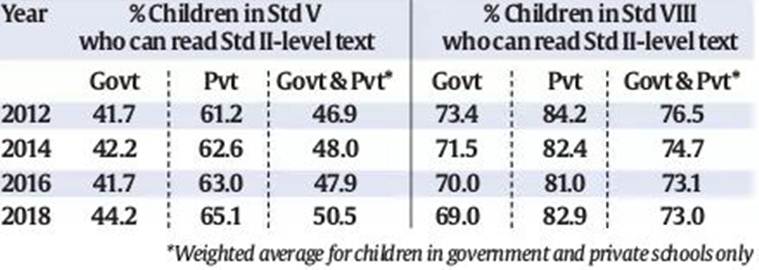
Attendance patterns by state
Overall, enrolment for the age group 6-14 has been above 96% in every year since 2010. Attendance, however, varies across states. The all-India figure for attendance is 70% to 74%.
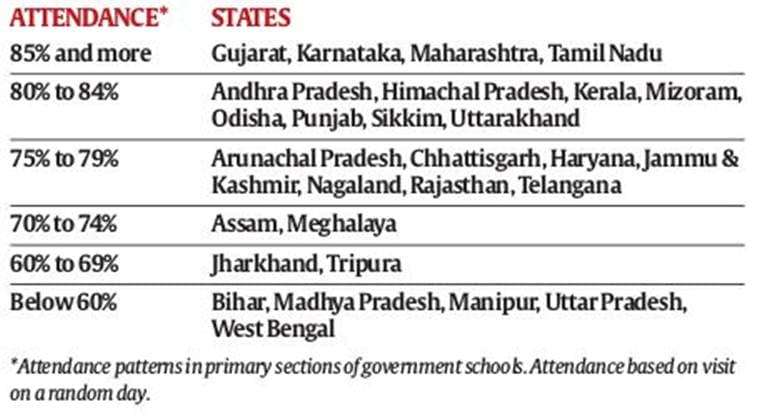
Proportion of girls out of school falling
The percentage of out-of-school girls aged 11-14 has fallen significantly over time. Even older girls (ages 15-16) are staying on in school, show ASER reports. The table compares the share of out-of-school (OoS) girls in 2018 with that in 2006 in selected states.
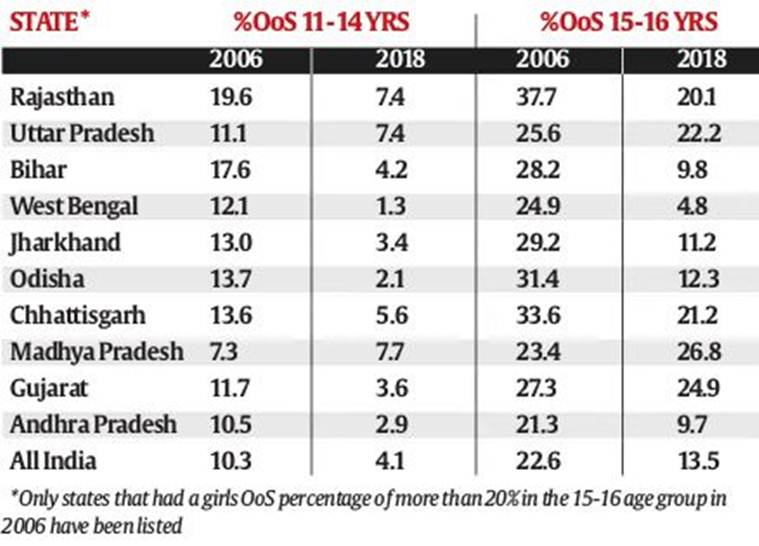
School facilities improving
In most states, school facilities have been improving over time, especially the provision of toilets, successive ASER surveys since 2010 show. As part of the ASER survey, one government school in the sampled village is visited. In ASER 2018, 15,998 govt schools were visited, which included 9,177 primary schools and 6,821 upper primary schools.
- ASER — Annual Status of Education Report — is a household-based survey of children’s schooling and learning status. Schooling status is recorded for children of ages 3-16, while children of ages 5-16 are tested for their ability to read simple text and do basic arithmetic.
- ASER is a rural survey — urban areas are not covered. In most years, ASER has attempted to reach every rural district of the country. Except for 2015, ASER has been conducted every year since 2005. Data are representative at district, state, and national levels, and ASER’s assessments are widely considered to be reliable.
- ASER 2018 was released. Selected data from the report will be published over the next few days.
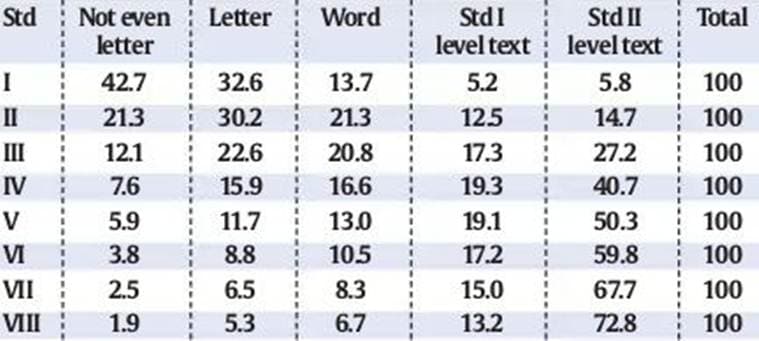
% CHILDREN BY GRADE AND READING LEVEL (All children, 2018)
The reading tool is a progressive tool. Each row in the table below shows the variation in children’s reading levels within a given grade. For example, among children in Std III, 12.1% cannot even read letters, 22.6% can read letters but not words or higher, 20.8% can read words but not Std 1-level text or higher, and so on. For each grade, the total of these exclusive categories is 100%.
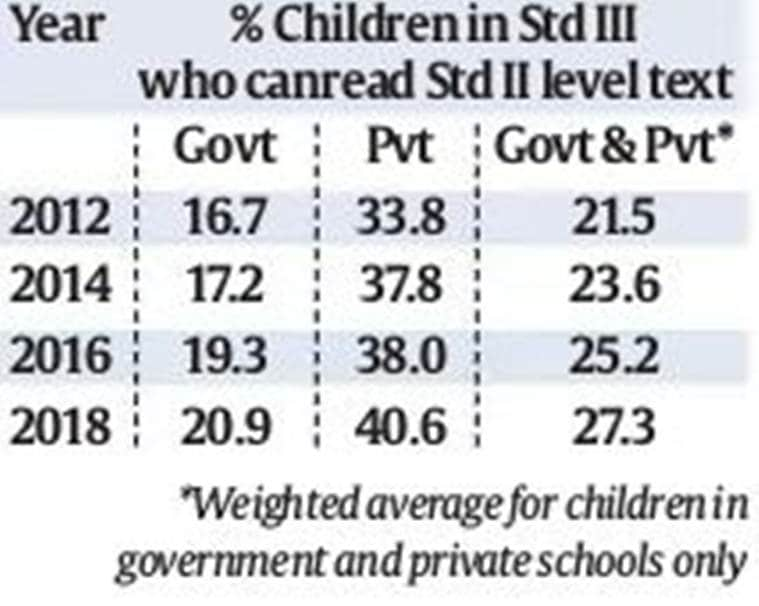
READING IN STD III: TRENDS OVER TIME (By school type, 2012-18)
The table shows the proportion of children in Std III who can read Std II-level text. This figure is a proxy for ‘grade level’ reading for Std III. Data for children enrolled in government schools and private schools are shown separately. As the figures suggest, in every year, Std III students in government schools have been half as likely as government school students to be able to read Std II-level text.
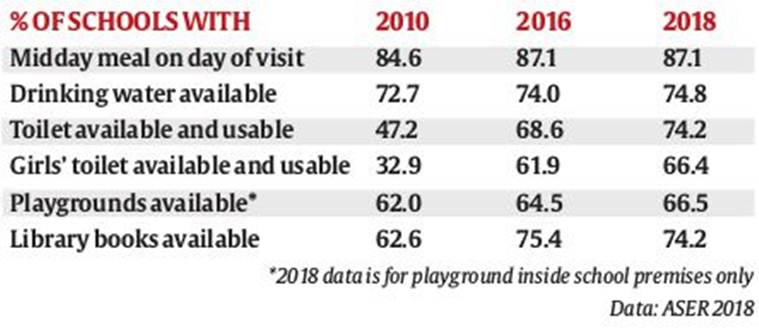
READING IN STDS V & VIII: TRENDS OVER TIME (By school type, 2012-18)
