
Context
-
The National Statistical Office (NSO), Ministry of Statistics and Programme Implementation is releasing in this Press Note the First Advance Estimates (FAE) of National Income at both Constant (2011-12) and Current Prices, for the financial year 2021-22 along with the corresponding estimates of expenditure components of the Gross Domestic Product (GDP), in accordance with the release calendar of National Accounts.
-
According to MoSPI, India’s gross domestic product (GDP) — the total value of all final goods and services produced within the country in one financial year — will grow by 9.2 per cent in 2020-21. Last financial year, FY21, the GDP had contracted by 7.3%.
What are the First Advance Estimates of GDP?
- The FAE, which were first introduced in 2016-17, are typically published at the end of the first week of January.
- They are the “first” official estimates of how GDP is expected to grow in that financial year. But they are also the “advance” estimates because they are published long before the financial year (April to March) is over.
- It is important to note that even though the FAE are published soon after the end of the third quarter (October, November, December), they do not include the formal Q3 GDP data, which is published at the end of February as part of the Second Advance Estimates (SAE).
Significance of First Advance Estimates
- Since the SAE will be published next month, the main significance of FAE lies in the fact that they are the GDP estimates that the Union Finance Ministry uses to decide the next financial year’s budget allocations.
- From the Budget-making perspective, it is important to note what has happened to nominal GDP — both absolute level and its growth rate.
- That’s because nominal GDP is the actual observed variable. Real GDP, which is the GDP after taking away the effect of inflation, is a derived metric. All Budget calculations start with the nominal GDP.
- Real GDP = Nominal GDP — Inflation Rate
- However, from the perspective of the common people, real GDP is what matters. The difference between the real and nominal GDP shows the levels of inflation in the year.
What are the main takeaways?
Real GDP Growth:
- At 9.2%, the real GDP growth rate for FY22 is slightly lower than most expectations, including RBI’s, which pegged it at 9.5%. What’s more, these estimates are based on data before the rise of the Omicron variant. As such, there is a possibility that the final rate may be revised further downwards by May-end when the full financial year’s “provisional” estimates will be published.
- While the GDP maps the economy from the expenditure (or demand) side — that is by adding up all the expenditures, the GVA provides a picture of the economy from the supply side. GVA maps the “value-added” by different sectors of the economy such as agriculture, industry and services.
Role of High Inflation:
- For FY22, while real GDP (that is, GDP calculated using constant 2011-12 prices) will grow by 9.2%, nominal GDP (that is GDP calculated using current market prices) will grow by a whopping 17.6%. The difference between the two growth rates — about 8.5 percentage points — is essentially a marker of inflation (or the rate at which average prices have increased in this financial year).
Low Private Consumption:
- An analysis of the three main contributors to GDP — private consumption demand, investments in the economy, and government expenditures — shows that while the latter two are expected to claw back to the pre-Covid level, the first engine will continue to stay in a slump.
- Private consumption expenditures typically account for more than 55% of all GDP. As Chart 2 shows, its level is expected to stay substantially the 2019-20 level. Such weak levels of private demand will make it difficult to sustain economic growth in the months and years ahead.
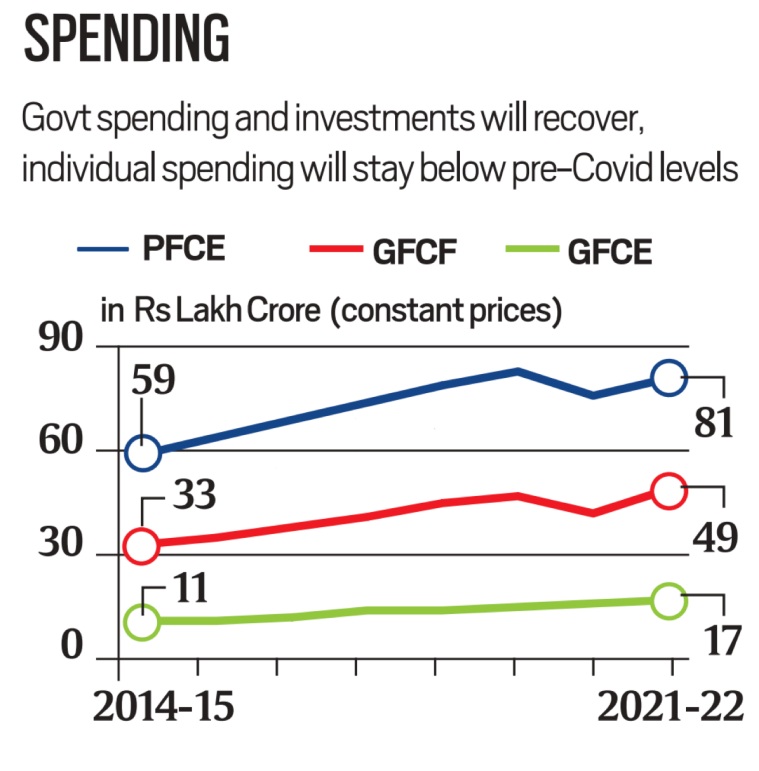
Source: MoSPI, RBI
Average Indian is much worse off:
- While aggregate GDP and GVA numbers may recover the same cannot be said about an average Indian. Two data points prove this.
- Chart 3 maps per capita GDP (a proxy for average income) and per capita Private Final Consumption Expenditure (a proxy for average spending). At the end of March 2022, while the average income is estimated to be below March 2020 level, the average spending will be lower than even the March 2019 levels, which marks the start of the second term of the recent government.
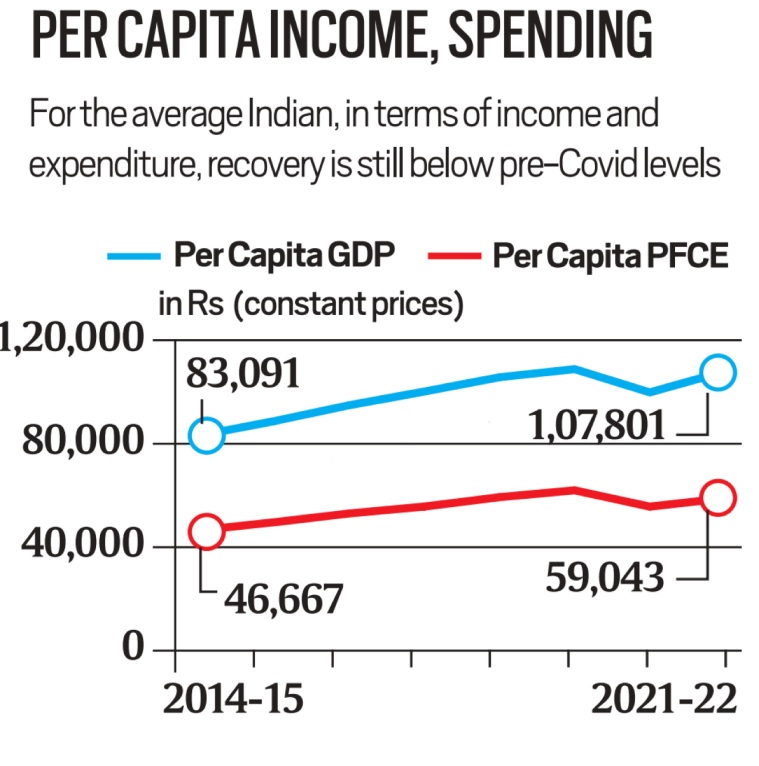
- In other words, an average Indian has lost 2 years in terms of income levels and 3 years in terms of spending levels.
Conclusion
- What’s more, even these average numbers do not capture the acute pain because of the growing inequalities in the country. For the bulk of the Indian population, thus, aggregate data recovering to pre-Covid levels may be largely academic.
Visit Abhiyan PEDIA (One of the Most Followed / Recommended) for UPSC Revisions: Click Here
IAS Abhiyan is now on Telegram: Click on the Below link to Join our Channels to stay Updated
IAS Abhiyan Official: Click Here to Join
For UPSC Mains Value Edition (Facts, Quotes, Best Practices, Case Studies): Click Here to Join