
Context
-
Recently, the government released the latest annual report of the Periodic Labour Force Survey 2019-20.
- The data was for the 12 months (or four quarters) between July 2019 and June 2020. It showed two surprising trends.
- One, India’s unemployment rate (UER) had declined over this period.
- Two, the Labour Force Participation Rate (LFPR) had increased.
Why are these results surprising?
- Over the last one decade, two of the biggest worries for Indian policymakers have been the high levels of UER and the low levels of LFPR in the economy.
- The LFPR is the proportion of Indians who seek to participate in the economy. In the recent past,
- India’s LFPR has been less than 40% — far below the global norm (around 60%) or even the norm in most Asian counterparts such as China (76%) and Indonesia (69%).
- In other words, of every 100, only 40 come forward to seek work in India, while the comparable number elsewhere is around 60.
Unemployment Rate
- The UER is the percentage of people in the labour force who do not get employment. Again, in the last few years, India’s UER has hovered around 6% (or higher) — far more than the global or regional norm. In other words, of those 40 who chose to participate in the economy, at least 6% did not get any job.
- A combination of low LFPR and high UER then implies two things.
- One, India is using a much smaller proportion of its population for productive purposes.
- Two, the state of the economy is such that it cannot provide jobs to this relatively smaller proportion of the labour force.
- The results are surprising because they correspond to a period when India’s GDP growth rate decelerated sharply; it came down to 4.2% in 2019-20.
Periodic Labour Force Survey (PLFS)
- The PLFS is an annual survey conducted by the National Statistical Office (NSO). It was started in 2017 and it essentially maps the state of employment.
- In doing so, it collects data on variables such as the level of unemployment, the types of employment and their respective shares, the wages earned from different types of jobs, etc.
- Earlier, this job was done by Employment-Unemployment Surveys, but these were conducted once every five years.
How does the PLFS calculate unemployment?
There are two ways, and they differ in terms of the reference period over which respondents have to recall whether they were working or not.
- One is called the Usual Status (US).
- In this approach, the survey ascertains whether a person had been employed for enough days in the 365 days preceding the survey.
- The second approach is called the Current Weekly Status (CWS).
- In this, the survey tries to figure out whether a person was adequately employed in the 7 days preceding the survey.
- In this, the survey tries to figure out whether a person was adequately employed in the 7 days preceding the survey.
- Typically, the NSO unemployment number most routinely quoted is the one based on Usual Status.
- But this approach is not comparable with either the global norm (say the one followed by International Labour Organization) or the private sector practice (such as the surveys done by the Centre for Monitoring Indian Economy or CMIE).
- The CWS is closer to the global norm.
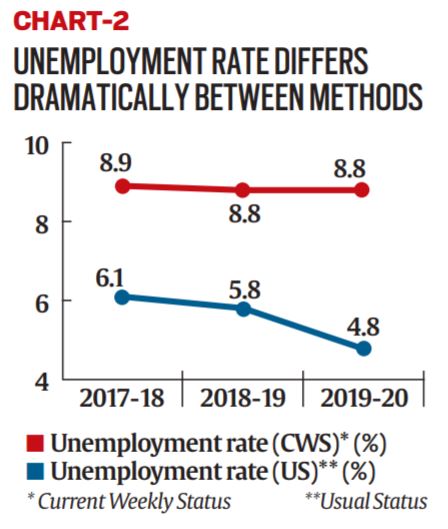
Table 2: Unemployment rate differs dramatically between US and CWS methods
| PLFS | 2017-18 | 2018-19 | 2019-20 |
| US—Unemployment rate* (in %)* | 6.1 | 5.8 | 4.8 |
| CWS—Unemployment rate^ (in %) | 8.9 | 8.8 | 8.8 |
Reason
- The rise in LFPR and the apparent fall in the unemployment rate are explained: “by the rise in distress”.
- The annual report one finds that increased labour force participation rate is happening because work opportunities have shrunk and incomes have fallen.
- People are being forced to take up self-employment often of the kind designated as “helper in household enterprise” even as the relative share of wage (or salaried) employment falls.
Conclusion
- Through the year, as GDP growth faltered, LFPR was falling further even as the unemployment rate worsened. This is particularly true for the April to June quarter of 2020 when the Indian economy was hamstrung by one of the strictest lockdowns anywhere in the world. The last column is particularly noteworthy since it shows unemployment levels among India’s youth. One in five youth failed to get a job — and this was before the pandemic.
Economy Current Affairs : Click Here