Context
-
Recently, World Meteorological Organization (WMO) released its annual State of the Global Climate 2020.
Key Highlights of State of the Global Climate 2020
- Extreme weather combined with COVID-19 in a double blow for millions of people in 2020.
- 2020 was one of the three warmest years on record, despite a cooling La Niña event.
- The global average temperature was about 1.2° Celsius above the pre-industrial (1850-1900) level.
- The six years since 2015 have been the warmest on record. 2011-2020 was the warmest decade on record.
- In 2020, over 50 million people were doubly hit – by climate-related disasters (floods, droughts and storms) and by the COVID-19 pandemic.
- Nearly 690 million people, or 9% of the world population, were undernourished, and about 750 million, or nearly 10%, were exposed to severe levels of food insecurity in 2019.
- Approximately 9.8 million displacements, largely due to hydrometeorological hazards and disasters, were recorded during the first half of 2020, mainly concentrated in South and South-East Asia and the Horn of Africa.
- Over the past decade (2010–2019), weather-related events triggered an estimated 23.1 million displacements of people on average each year.
- One impact of rising CO2 concentration is ocean acidification.
- The ocean absorbs around 23% of the annual emissions of anthropogenic CO2 to the atmosphere, helping to alleviate the impacts of climate change but at a high ecological cost to the ocean.
- Around 90% of the excess energy that accumulates in the earth system due to increasing concentrations of greenhouse gases, goes into the ocean.
- Ocean Heat Content (OHC) is a measure of this heat accumulation in the Earth system. It is measured at various ocean depths, up to 2000m deep.
- In 2020, more than 80% of the ocean experienced at least one MHW, causing significant impacts to marine life and the communities that depend on it.
- Rising global temperatures have contributed to more frequent and severe extreme weather events around the world, including cold and heat waves, floods, droughts, wildfires and storms.
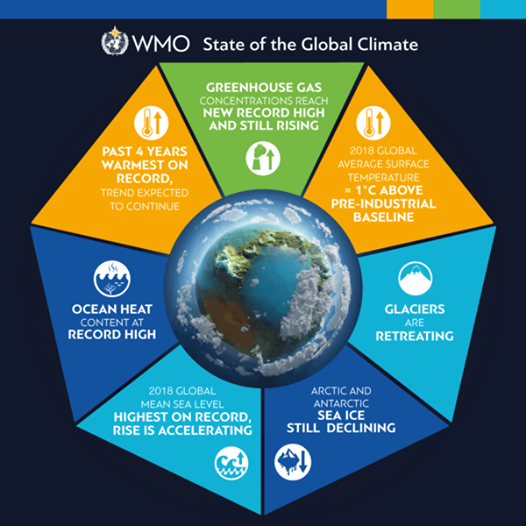
The WMO’s State of the Global Climate 2020 report listed five key indicators of irreversible changes in the global climate:
- Greenhouse Gases: Notwithstanding the economic slowdown due to the COVID-19 pandemic, emission of major greenhouse gases increased in 2019 and 2020.
- Oceans: In 2019, the oceans had the highest heat content on record. In 2020, it has broken this record further. “Over 80 per cent of the ocean area experienced at least one marine heatwave in 2020.

- Sea-level rise: Since record-taking started in 1993 using the satellite altimeter, sea-level has been rising. However, there was a blip in summer of 2020 that recorded a drop in sea level. “Sea level has recently been rising at a higher rate partly due to the increased melting of the ice sheets in Greenland and Antarctica.”
- The Arctic and the Antarctica: In 2020, the Arctic sea-ice extent came down to second lowest on record. “The 2020 Arctic sea-ice extent minimum after the summer melt was 3.74 million square kilometre, marking only the second time on record that it shrank to less than 4 million sq km. In a large region of the Siberian Arctic, temperatures in 2020 were more than 3°C above average, with a record temperature of 38°C in the town of Verkhoyansk.
The Big 3
- Carbon dioxide (CO2) is the most commonly addressed greenhouse gas, and its atmospheric concentration is measured by parts per million (ppm). Methane (CH4) and nitrous oxide (N2O) are also extraordinarily important for the global climate and are measured by parts per billion (ppb).
Global Mean Surface Temperature
- As greenhouse gas concentrations rise, so does global mean surface temperature (GMST). GMST is measured using a combination of air temperature two meters over land, and sea surface temperature in ocean areas from various databases, typically expressed as an anomaly from a baseline period.
Reports and Indices for UPSC 2021 : Click here
