Context
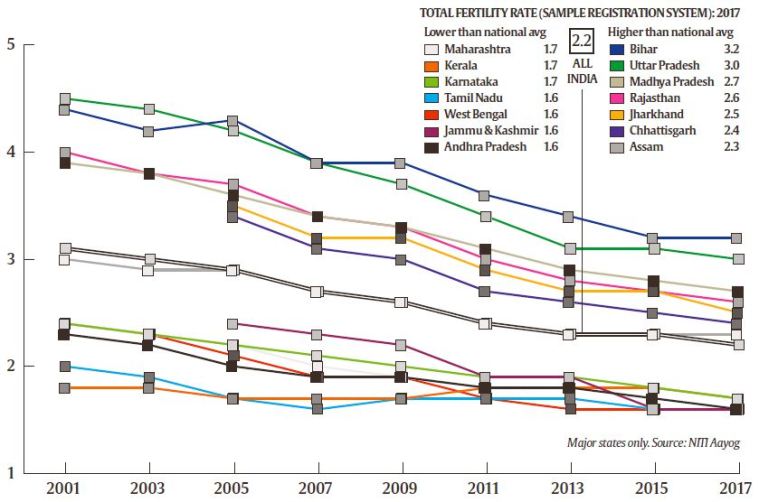
- The graph (below) shows trends for the total fertility rate (TFR) in various states. TFR, defined as the number of children born to a woman until the end of her child-bearing age, is a key indicator for population trends.
The graph is based on TFR data from the Sample Registration System (SRS) undertaken by the Office of the Registrar General of India. The SRS also looks at other indicators such as crude birth rate, general fertility rate, age specific/marital fertility rate, gross reproduction rate along with sex ratio at birth. While Census figures provide the total population every decade, the regular SRS estimates provide dynamic trends underlying the population growth.

- After four successive years (2013-2016) when the TFR stagnated at 2.3 births per woman of child-bearing age, the latest SRS estimates (2017) show the TFR dropping to 2.2. This figure is only marginally higher than the fertility rate (2.1) required for replacement of the existing population.
- SRS estimates over the last decade and more, meanwhile, show a declining trend across the country. Even the states that have a higher TFR — Uttar Pradesh (3.0), Bihar (3.2), MP (2.7), Rajasthan (2.6), Assam (2.3), Chhattisgarh (2.4) and Jharkhand (2.5) — have been witnessing a declining trend in fertility rates. These seven states account for about 45 per cent of the total population in the 2011 Census. Two more states, Gujarat and Haryana, recorded a TFR of 2.2, which is above the replacement rate but is equal to the national average. Taken together, these nine major states account for 52 per cent of the 2011 population.
- This means that in the states barring these nine, and accounting for almost half the population, the replacement level is either 2.1 or has gone below it. These states with a lower TFR include Kerala (1.7), Tamil Nadu (1.6), Karnataka (1.7), Maharashtra (1.7), Andhra Pradesh (1.6), Telangana (1.7), West Bengal (1.6), Jammu and Kashmir (1.6) and Odisha (1.9).
Source:IE
